In brief:
Adjusting the Hall sensors and their electronics.
Measuring the accuracy of the setup.
This procedure can be done in the Lab or Workshop. When the TopMount is at its final destination no additional justage should be necessary.
Assumed here is that when the magnet is placed the voltage level on the Hall sensor outputs will be lower than the midscale level they have when the magnet is not present. As the amplifiers are inverting the readout is increasing when the magnet approaches a sensor.
1/ Lock the magnet to the center with the locking tool.
2/ Verify with a non magnetic ruler that the distances between the magnet and the Hall sensors are very much the same for all 4 sensors. If not, re-adjust the PCB or one or more of the sensors.
3/ Set the gain to maximal with the Gain potmeters.
4/ Adjust the Offset pots for a reading of 128.
5/ Lower the locking tool.
6/ Move the wire to the North, such that the 6 mm tube just touches the edge of the hole in the lower plate. Reduce the North Gain potmeter for a reading of 250. Repeat this for South, East and West.
I was able to measure the accuracy of the Hall system with an old A3 plotter from which I only had the mechanical part (plotting bed with stepper motors) and for which I realized some new electronics to control the steppers.
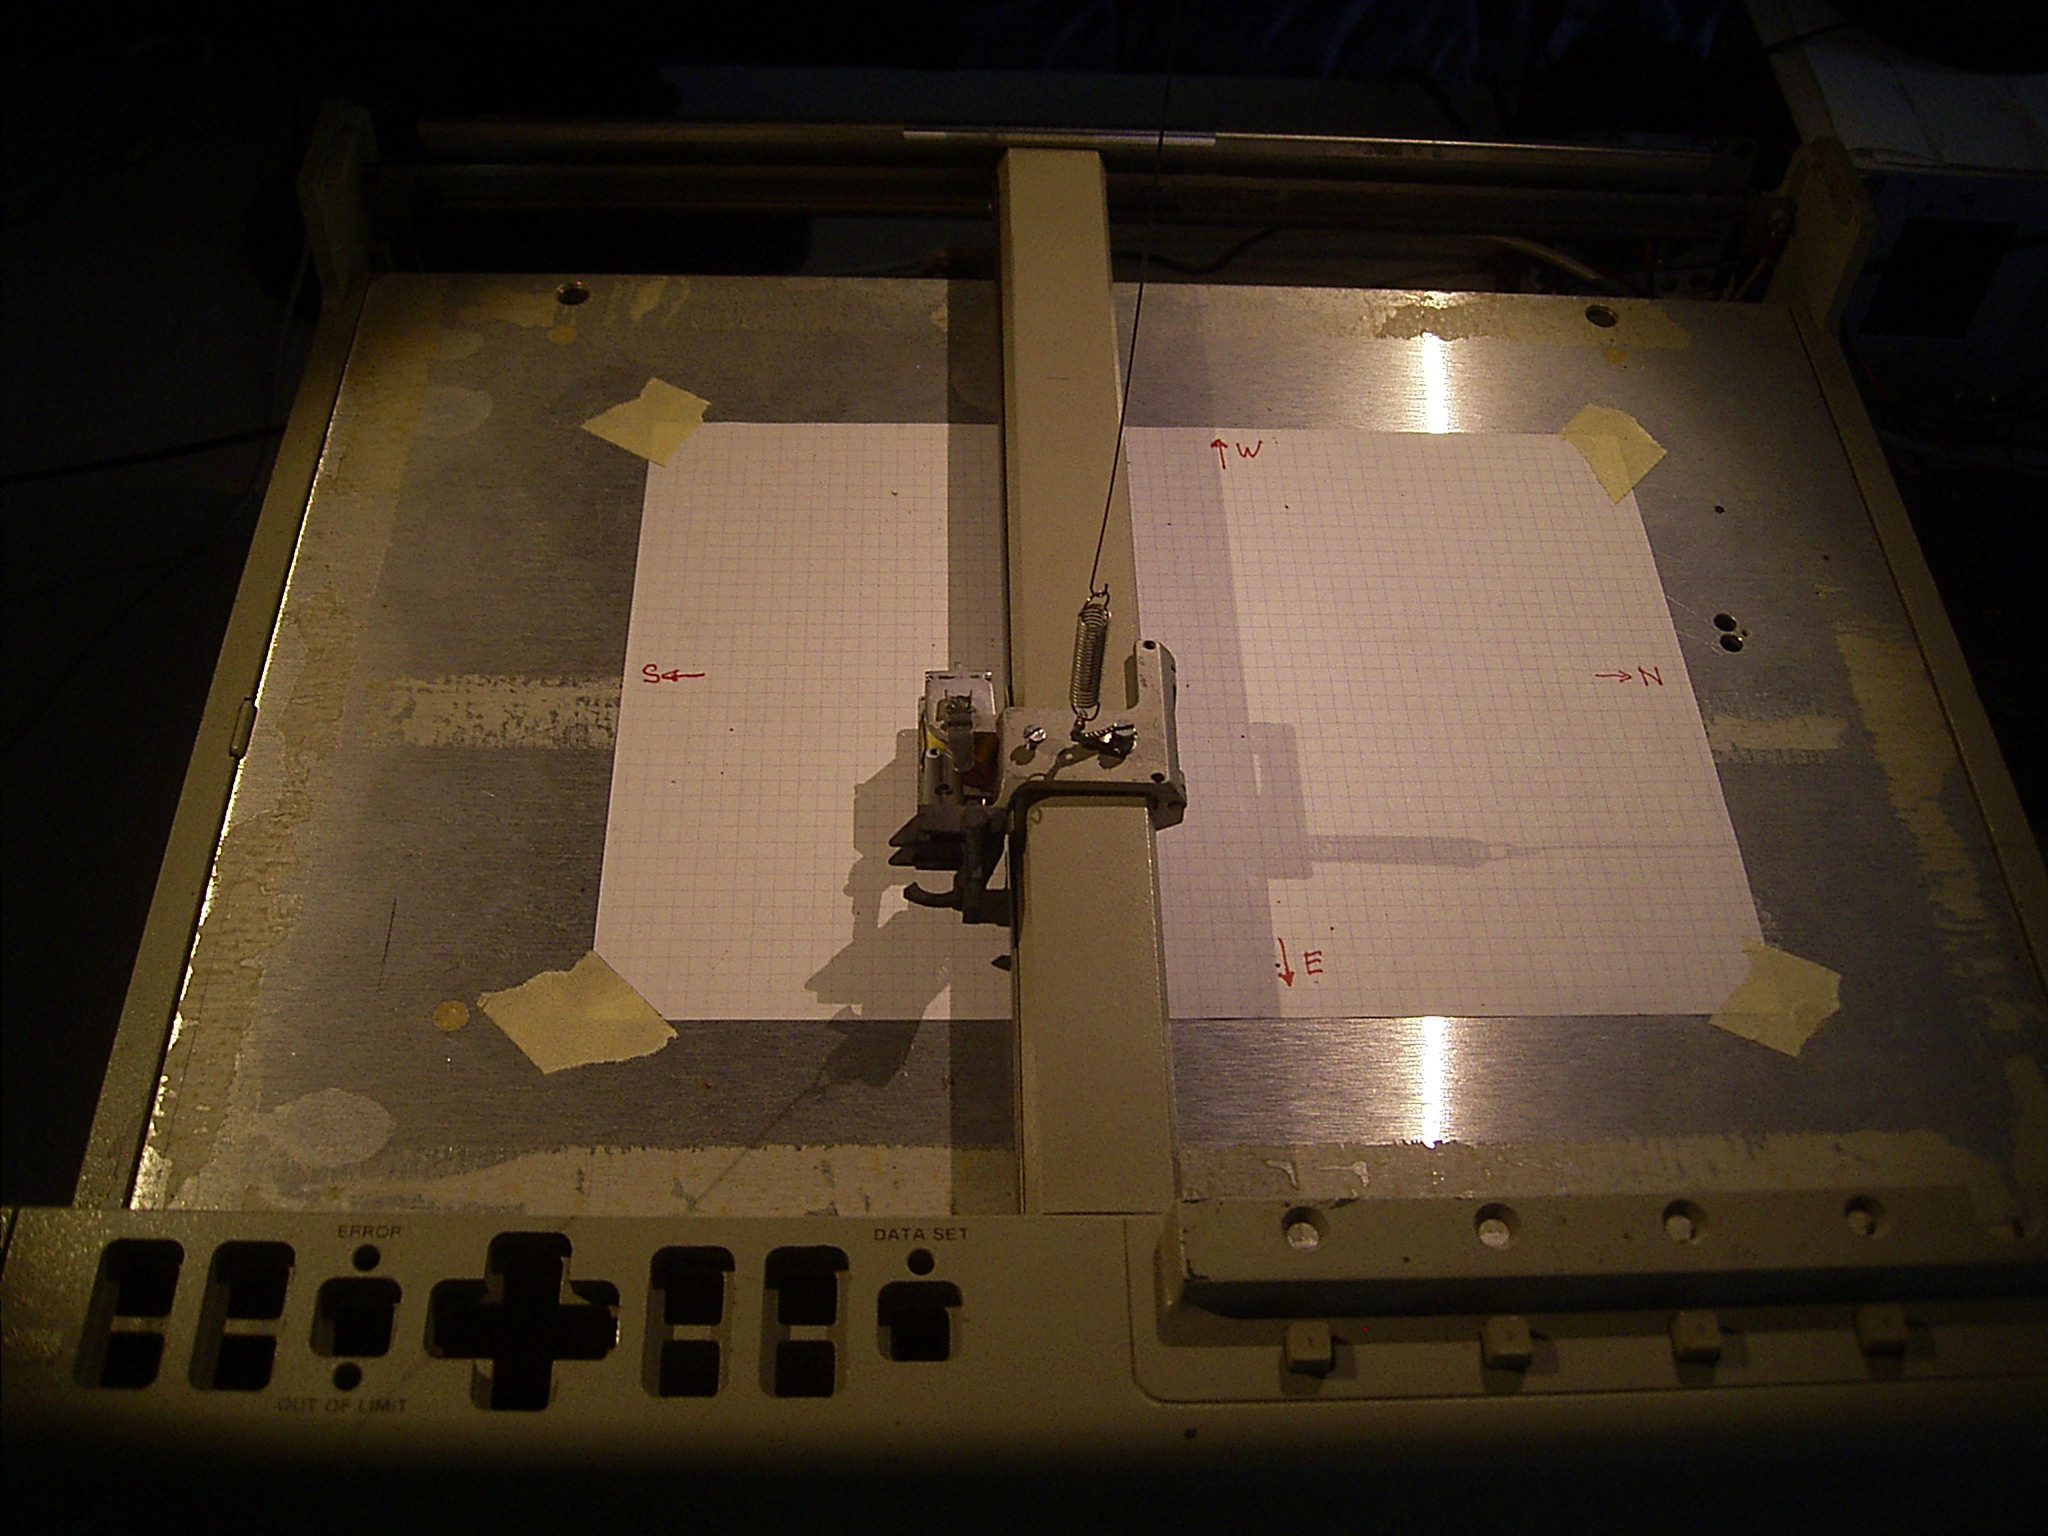
Fig 1. The A3 plotter with the wire attached.
The plotter was centered below the top mount at 134 cm above the plotter bed and the wire was attached to the plotting head with a small spring.
A specially written program moved the plotting head from -200 to + 200 mm in NS and EW direction in steps of 20 mm, and registered the readings from the Hall sensors. After that the readings were graphically presented.
To prevent the magnet to wobble the movements were done very slowly, after a movement during about 2 seconds no data were registered and after that the data of 2 seconds were averaged. One complete measurement lasted around 25 minutes.
Some results below:
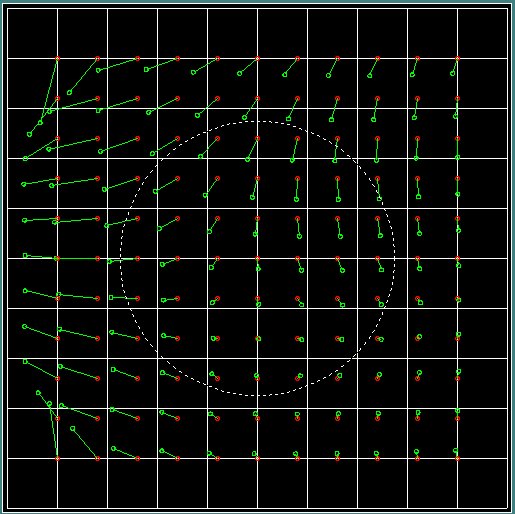
Fig 2. Measurement without serious calibration.
The red circles represent the measuring locations, the green circles are the measured results after some scaling. The green lines indicate which result belongs to which location.
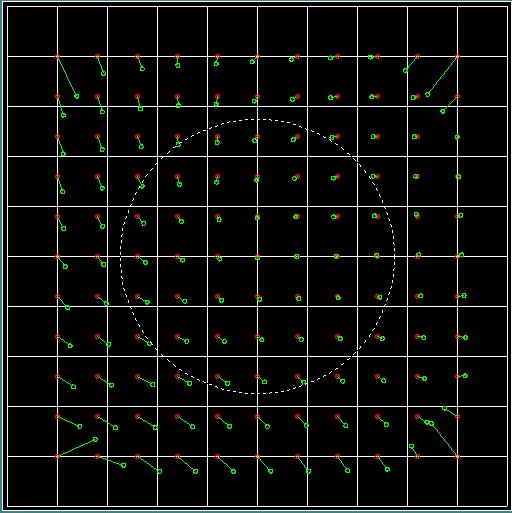
Fig 3. After the adjustment procedure above.
The large errors in the corners result from the magnet stem touching the lower plate. A small rotaional error results from a misalignment between the plotter and the topmount.
When I map the amplitude /height ratio of the pendulum in my home to this setup I find the dotted circle to represent the actually used part of the range. For the time being I accept these residual errors.